Appearance
State Report
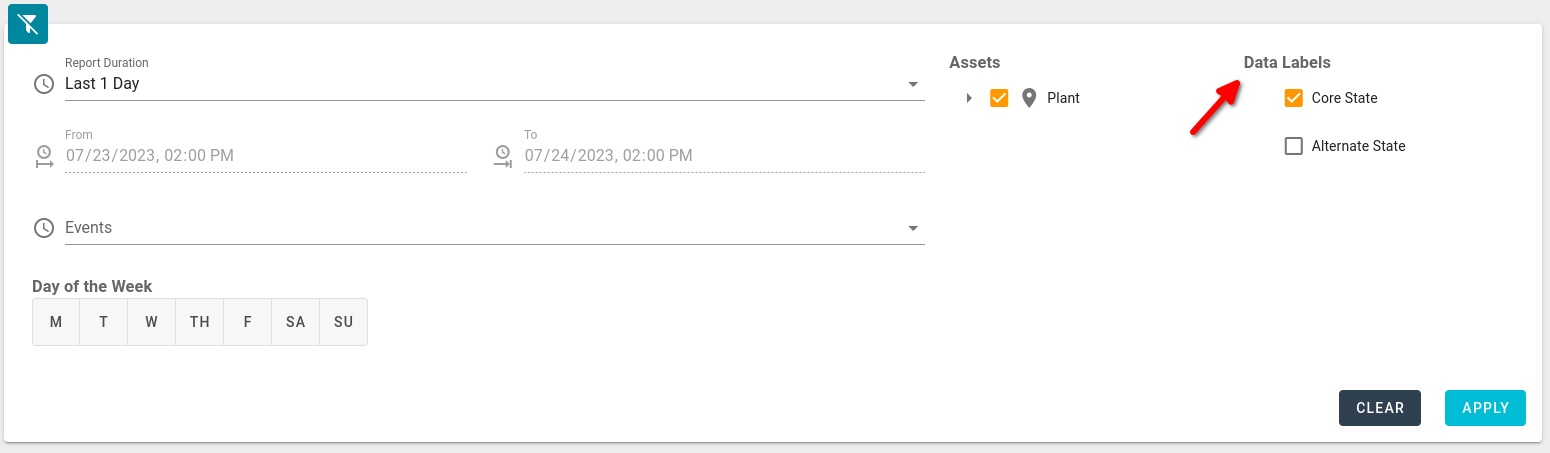
The filter section of the report allows one to supply the critera needed for the report to run.
- Report Duration: Allows selection of the duration of the report with some predefined shortcuts
- From/To: The actual date/time values used when the report is run
- Events: allows narrowing of the result-set to only include data that occurred during a particular Calendar Event, for example: Shift A
- Day of the Week: Because a shift can span more than one day, the Shift Day value assigned to the specific calendar event is used
- Assets: The asset tree allows the selection of the assets expected to have data in the report results
- Data Labels: The types of state labels to report on
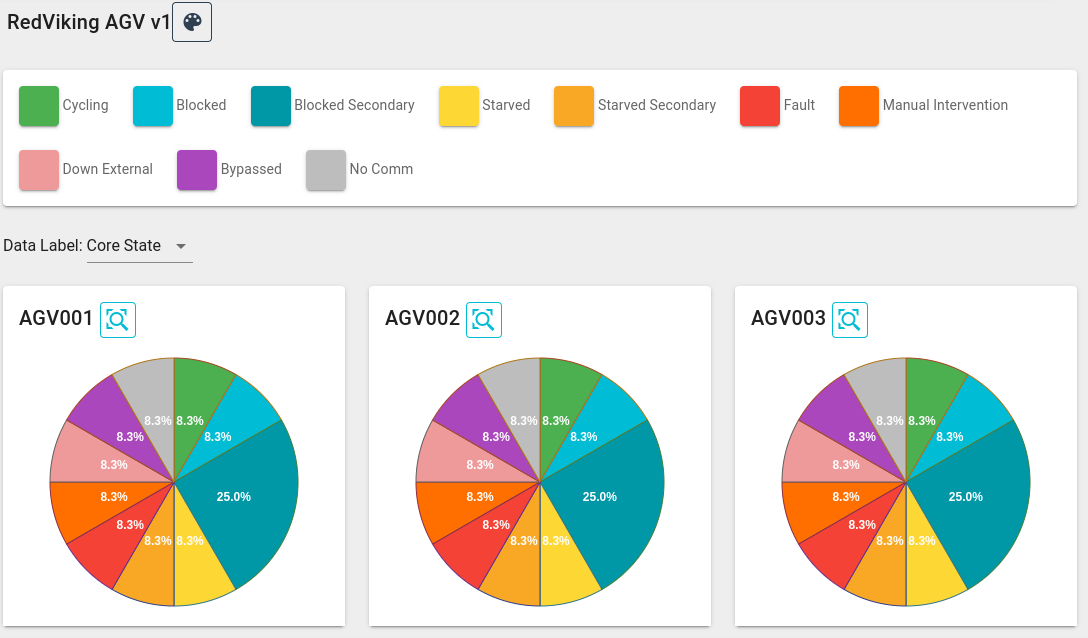
The State Report displays a series of charts for each Asset selected by the filters. By default, the pie chart represents the total amount of time an asset was in a state. If filters are chosen that skip certain blocks of time (for example, 1 Week of Shift-A) then only the time applied in the filters will be included in the chart.
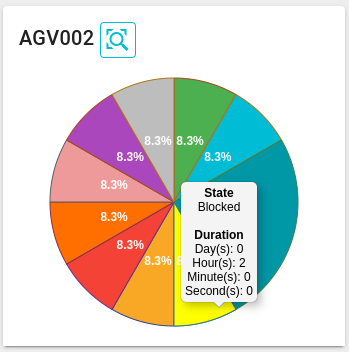
Hovering the mouse cursor over a state will display more details about the state, such as the name and duration
Selecting the magnifying glass displays a timeline representation of the pie-chart

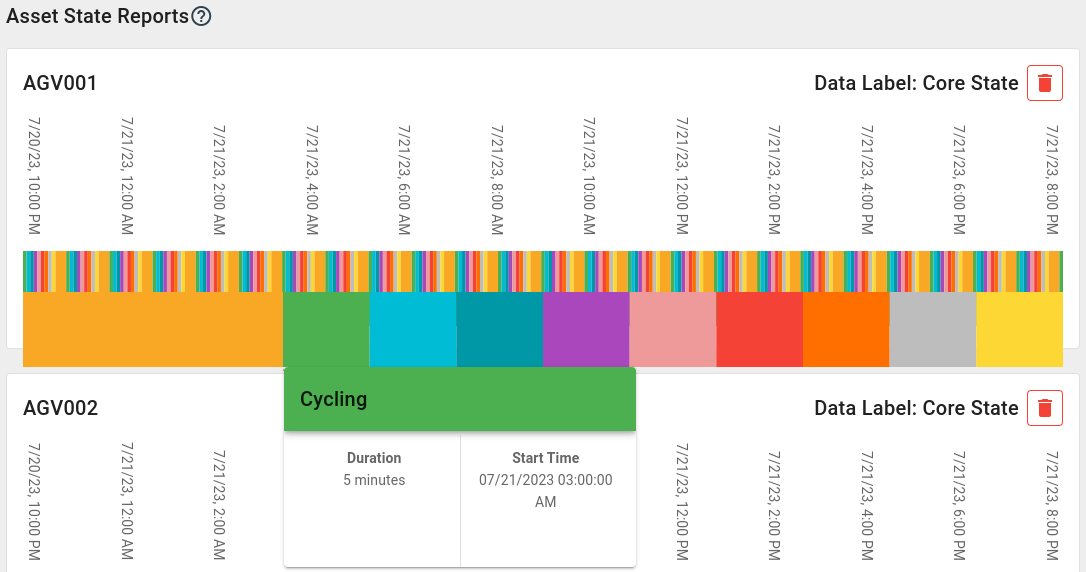
The states are layed out in a timeline fashion from left to right (left being earliest). The width of the states displayed is proportional to the total amount of time being represented. Hovering over a state displays a card with the more details about the state, such as the duration and when the event began. The color of the state is can be defined in the Asset Type page if it is not a Core State.
More than one Timeline view can be selected allowing for comparison of different assets along the same timeline, or different Data Labels of the same asset if so desired.