Appearance
Fault Report
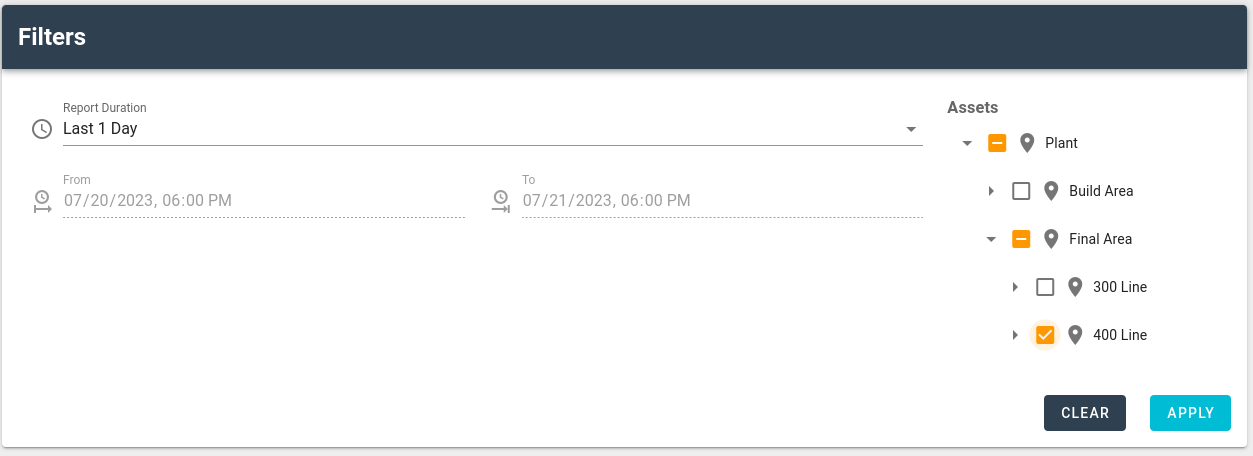
The filter section of the report allows one to supply the critera needed for the report to run.
- Report Duration: Allows selection of the duration of the report with some predefined shortcuts
- From/To: The actual date/time values used when the report is run
- Assets: The asset tree allows the selection of the assets expected to have data in the report results

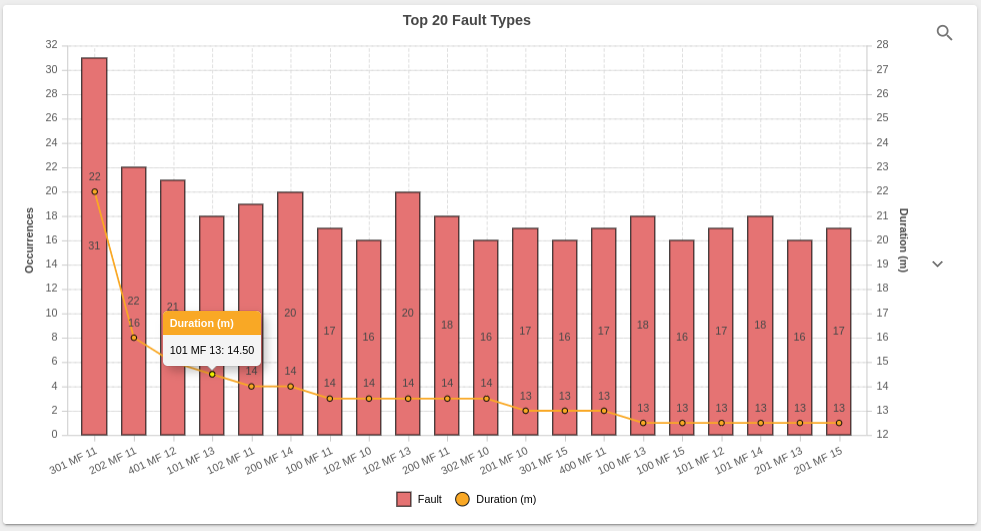
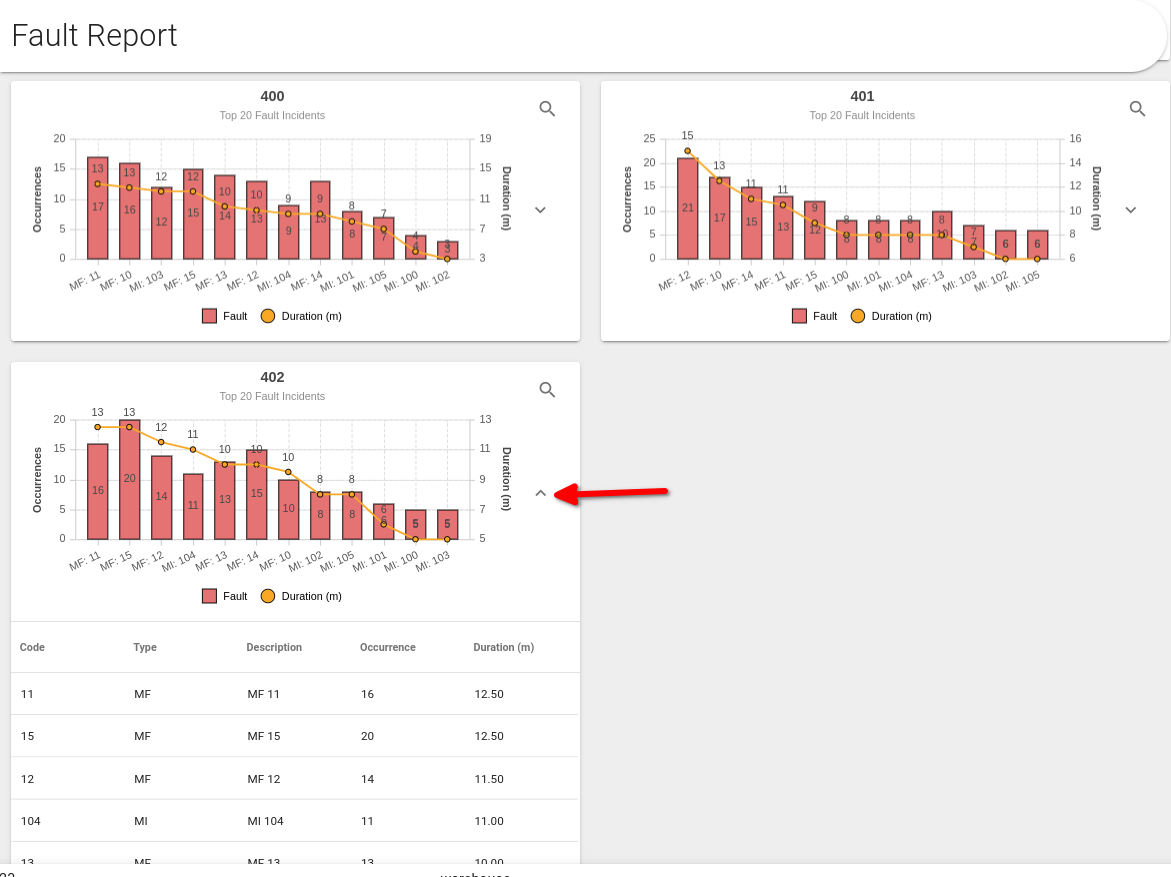
Displays a chart for each asset detailing the top 20 faults for that asset ordered by duration. Along the top is a larger overview report, that will show the top 20 overall faults. This type of view is useful for determining which faults are causing the most stops to productive time. Along the top-right corner of each report is a magnifying glass that allows a detailed timeline view without any aggregations applied, to see exactly when a fault (or intervention) ocurred.

Along the right side of the bar chart is a down arrow, that when selected opens a detail view of the charted data in table form. The primary benefit to this view is to see what the configured description of the fault/intervention is.
Note: If no description is configured in the Asset Type configuration for the recorded code, only the recorded code will be displayed.

- Code: The machine code
- Type: Either MF for Machine Fault, or MI for Manual Intervention
- Description: The description configured in the Asset Type configuration for the specified asset
- Occurrence: The recorded occurrence count of the fault/intervention
- Duration: The duration (in minutes) of the recorded fault/intervention
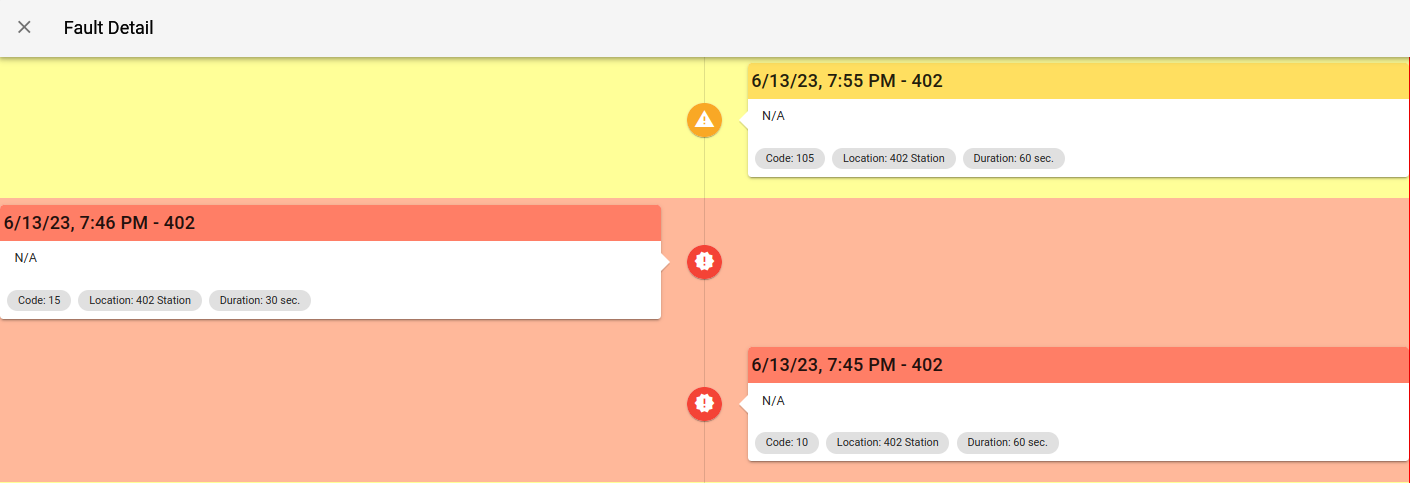
If Fault/Intervention data is present, a magnifying glass icon will be available to view a more detailed timeline view of the data

The data in this view displays the date-time of the occurrence, a description if available, the numeric code value, the location of the asset, and the duration in seconds of the Fault/Intervention. If the titlebar of the entry is red, then the entry being displayed is a Fault, if yellow then a Intervention.