Appearance
Constraint Analysis Report
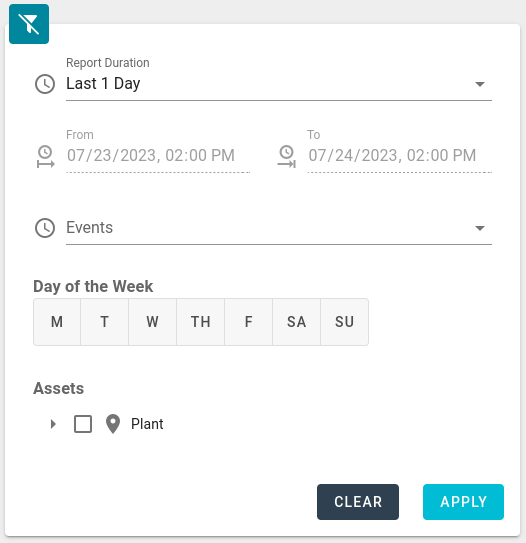
The filter section of the report allows one to supply the critera needed for the report to run.
- Report Duration: Allows selection of the duration of the report with some predefined shortcuts
- From/To: The actual date/time values used when the report is run
- Events: allows narrowing of the result-set to only include data that occurred during a particular Calendar Event, for example: Shift A
- Day of the Week: Because a shift can span more than one day, the Shift Day value assigned to the specific calendar event is used
- Assets: The asset tree allows the selection of the assets expected to have data in the report results
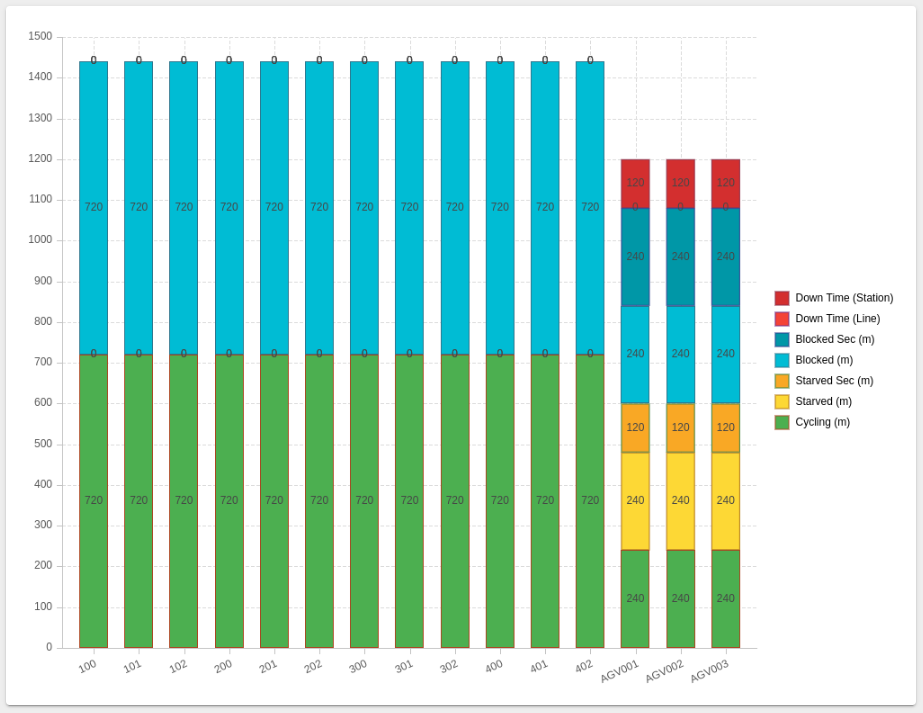
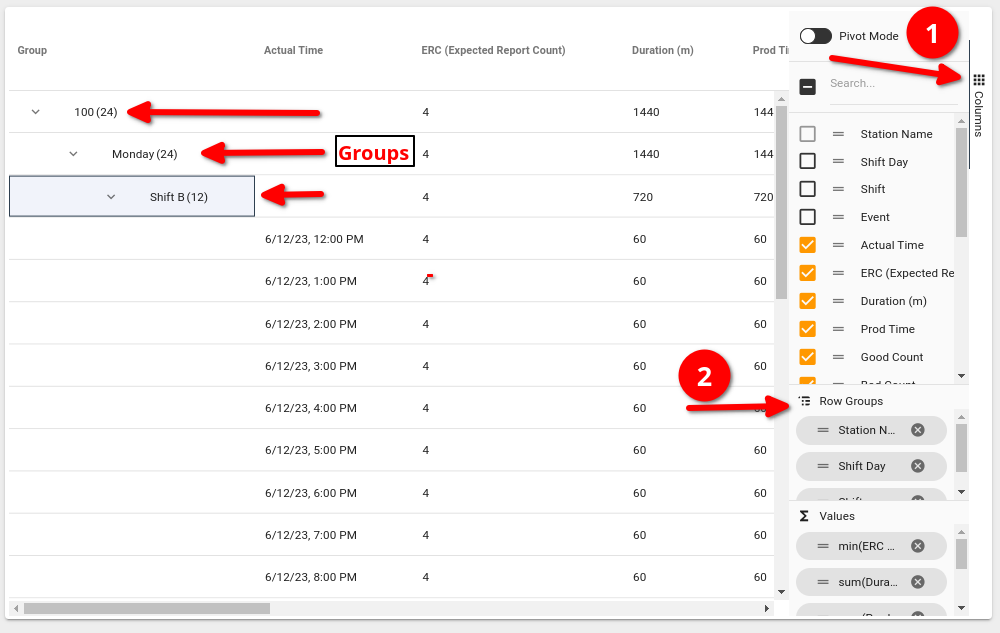
The Constraint Analysis Report displays a bar-chart of Asset data grouped by Asset and Core State, and a table view of the same Asset data grouped by Asset, Shift Day, Calendar Event, and hour.
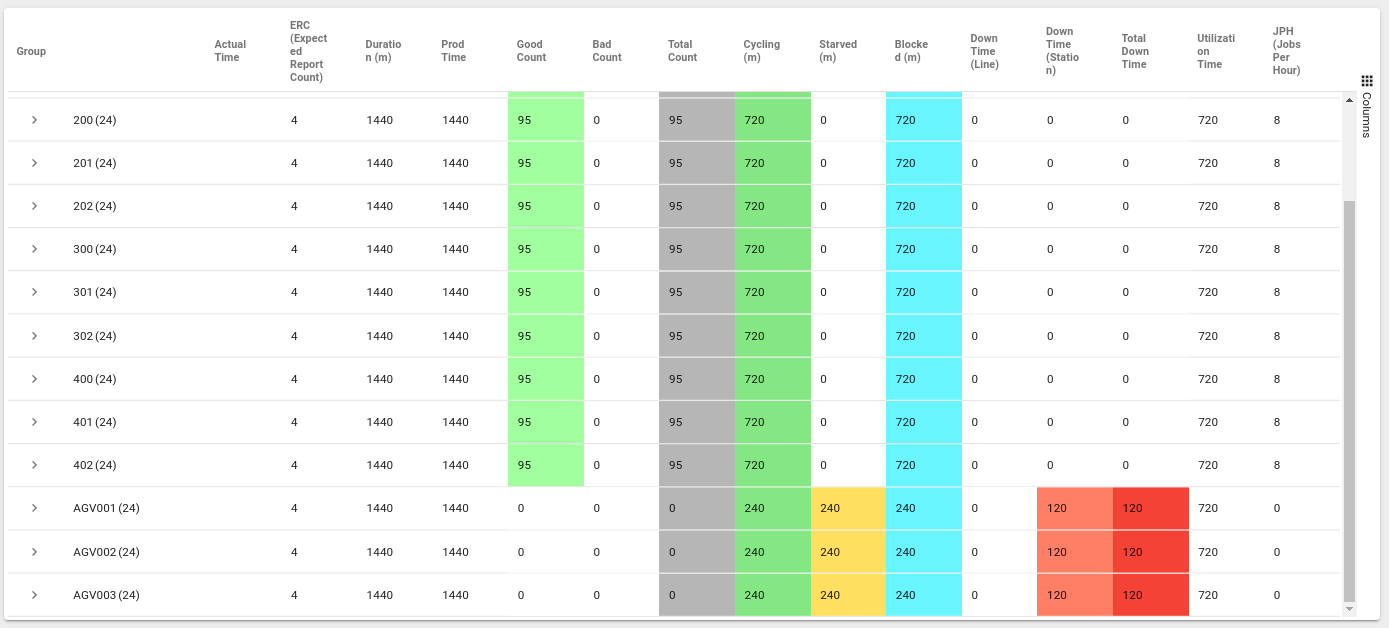
- The table view allows configuration of this grouping by selecting the "Columns" button to the right of the table data.
- Scrolling down to the "Row Groups" section in the side bar allows the default grouping to be changed.
For example, clicking the "x" button next to the Row Group configuration of "Shift Day" will remove the grouping, allowing the table to render the aggregated durations for the entire shift.
- The ERC column specifies the amount of good parts produced per hour, and is calculated from the Asset configured "Cycle Time" setting
- Duration is an aggregated duration in minutes of the calendar event (example: commonly 60 if the event spans the entire hour)
- Prod Time is the amount of productive that that occurred within the event for this hour
- Good Count is the amount of Good Counts attributed to this hour
- Bad Count is the amount of Bad Counts attributed to this hour
- Total Count is the combination of both Good & Bad Count attributed to this hour
- Cycling, Starved, Blocked Downtime (Line), Downtime (Station) are the durations of core states attributed to this hour
- Total Downtime is the combination of both Station & Line down states attributed to this hour
- Utilization Time (Cycling + Secondary + Total Down)
- JPH (Cycling State (h) / Total Counts)
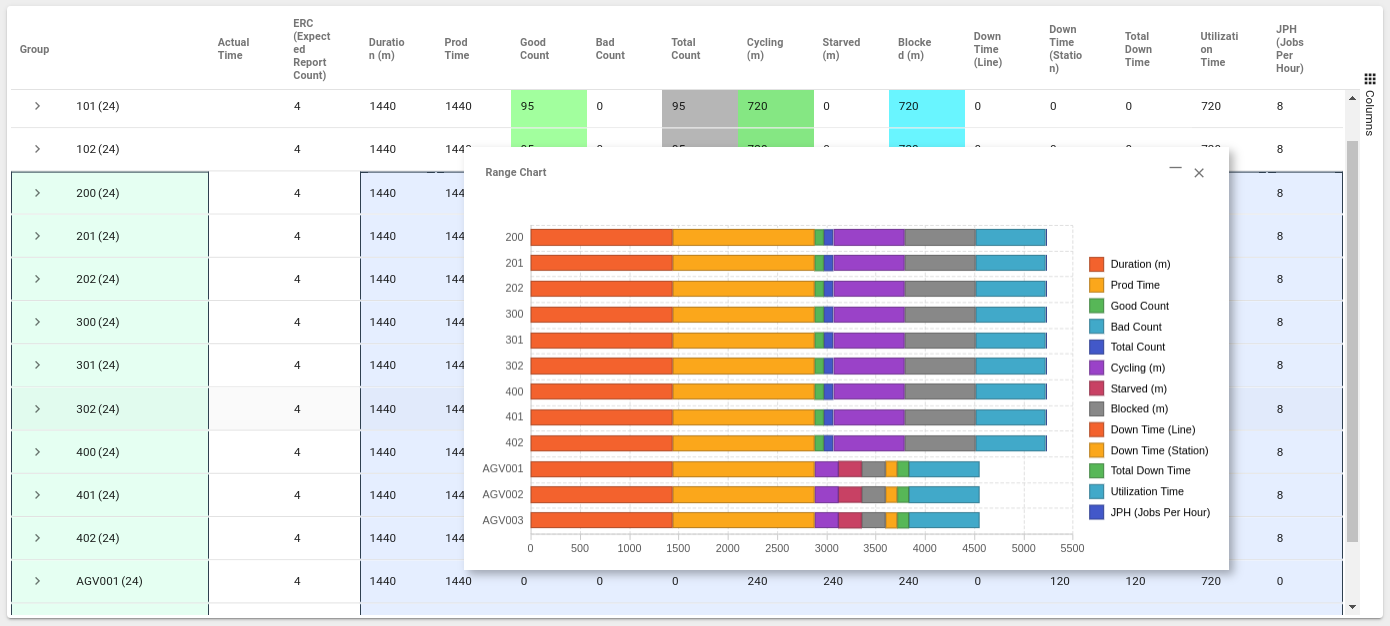
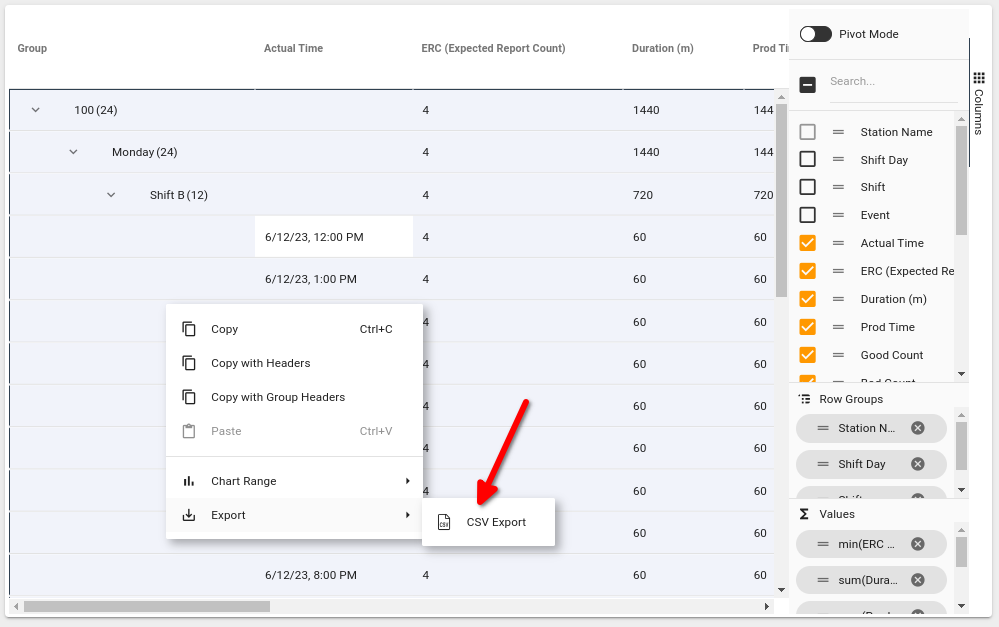
When the table is selected, pressing CTRL+A (or using the mouse to select a subset of rows) followed by a right-click will display a menu that allows for further action to be performed on the selected data. For example: "Chart Range" allows for charting & graphing, while "Export" allows for a CSV export of the selected data.